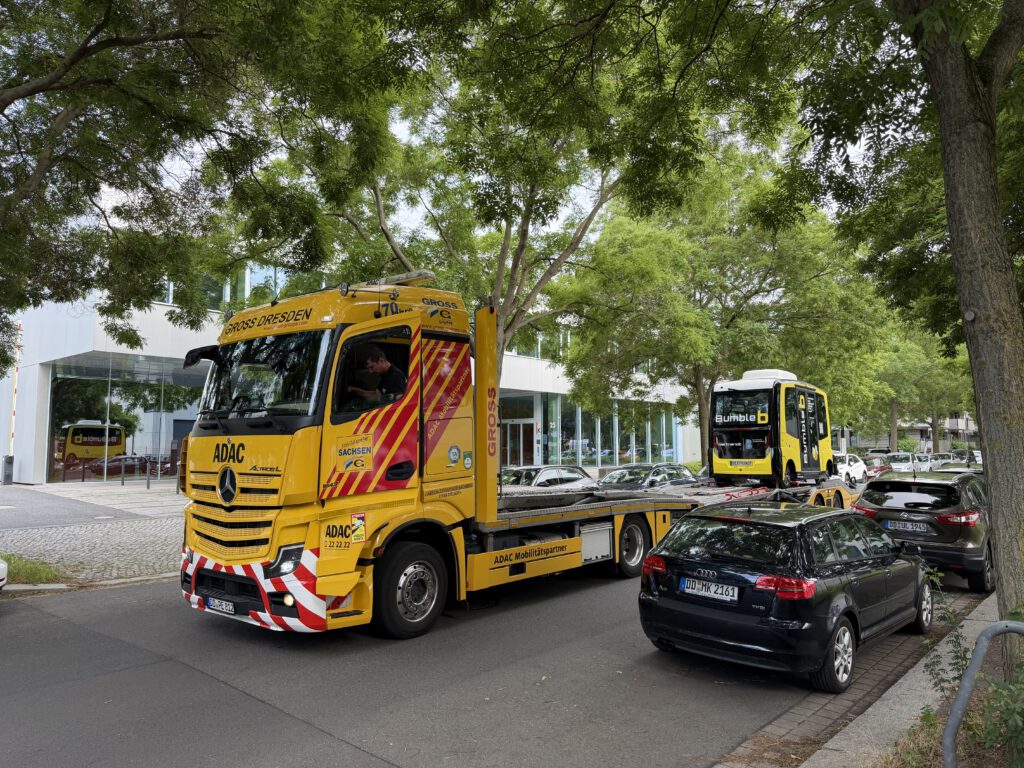
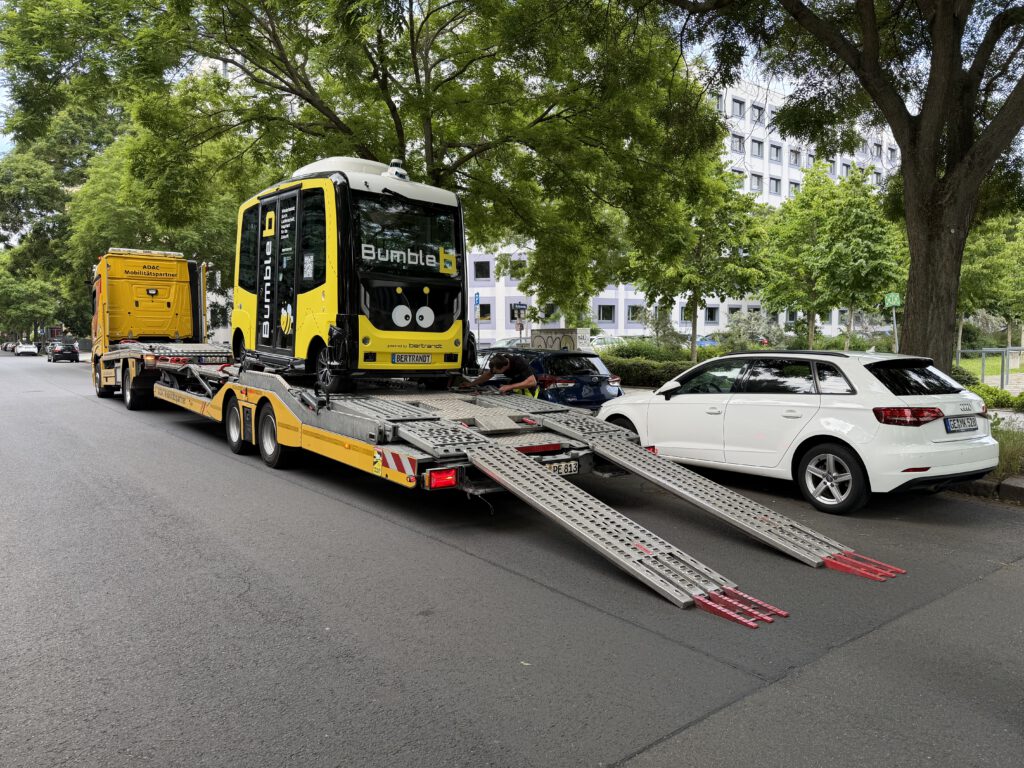
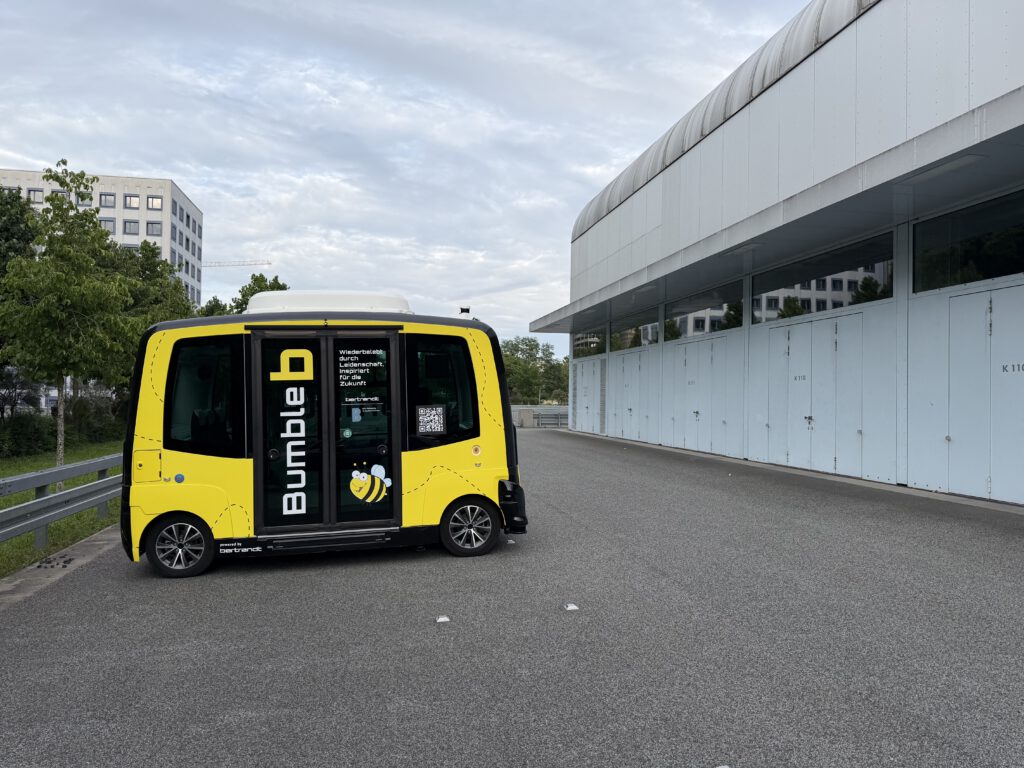
Gastvorlesungen // Guest lectures

Zur Intensivierung der internationalen Zusammenarbeit besuchte Prof. Toralf Trautmann Anfang März die Universitäten Triest (Italien) und Koper (Slowenien). Neben Vorlesungen zu automatisierten Fahrfunktionen wurde im Fahrversuch eine auf Basis eines Lidar-sensors entwickelte Automatische Notbremsfunktion vorgestellt. Eine erste Folgeveranstaltung wird ein Hackathon im Herbst sein.

To intensify international cooperation, Prof. Toralf Trautmann visited the universities of Trieste (Italy) and Koper (Slovenia) at the beginning of March. In addition to lectures on automated driving functions, an automatic emergency braking function developed based on a lidar sensor was presented in driving tests. The first follow-up event will be a hackathon in the fall.

Erster Fahrtest erfolgreich // First driving test successful

Die Arbeitsgruppe „Virtual System Development“ des Fraunhofer-Instituts IIS/EAS führte in KW 7 erste Versuche mit ihrer Messtechnik auf dem HTWD-Prüffeld erfolgreich durch. Es wurden verschiedene Szenarien aus dem urbanen Bereich mit dem Umfeld-Modul des Institutes aufgenommen. Eine erste Auswertung zeigt die Leistungsfähigkeit der Sensorik und der zugehörigen Erkennungssoftware. Ansprechpartner für weitere Informationen ist Gruppenleiter Dr. Christoph Sohrmann.

Der Kontakt zur Arbeitsgruppe entstand auf der VDI-Tagung Umfelderfassung im November 2023. Danach wurde eine Zusammenarbeit zwischen dem Institut, der HTW Dresden (Mechlab) und der Firma tracetronic vereinbart. Der Testlauf auf dem Prüffeld war hierbei nach gegenseitigen Besuchen die erste konkrete Umsetzung. Nachfolgend zu sehen sind einige Impressionen der Datenaufnahme sowie eine erste Auswertung (Rohdaten und Objekterkennung).

The „Virtual System Development“ working group of the Fraunhofer Institute IIS/EAS successfully carried out the first tests with their measurement technology on the HTWD test field in week 7. Various scenarios from the urban area were recorded using the institute’s environment module. An initial evaluation shows the performance of the sensors and the associated detection software. The contact person for further information is group leader Dr. Christoph Sohrmann.

Contact with the working group arose at the VDI “Environmental Perception” conference in November 2023. A collaboration was then agreed between the institute, HTW Dresden (Mechlab) and the company tracetronic. The test run on the test field was the first activity after mutual visits. Below you can see some impressions of the data recording as well as an initial evaluation (raw data and object recognition).

Video der Rohdaten // Video of raw data
Video der Objekterkennung // Video of object detections

Pointcloud Visualization at ZalaZONE

Introduction

We visited ZalaZONE late November this year. It is located in Zalaegerszeg, Hungary, one hour east of the Austrian-Hungarian border. With about 260 ha of space the ZalaZONE test ground provides test oppertunities and facilities for the testing of a wide range of future mobility concepts. Though a lot of the test ground is still „work-in-progess“, within our cooperation with ZalaZONE we were granted access to establish some test sequences on the completed testsections.

Following measurements were recorded on November 28th with mostly poor weather conditions (cloudy, occasional light to heavy rain). The measurements took place in different designated areas of the testground. The following interpretation discusses general effects, problems and characteristics of the lidar pointcloud(s) and partly introduces and discusses the testfield area in use.

The hardware being used consits mainly of some of the following parts:

  • Cohda Mk5 (OBU – Onboard Unit & RSU – Roadside Unit)
  • Ouster Lidar (64 layer laserscanner)
  • Velodyne VLP-16 (16 layer laserscanner)
  • ublox GPS
  • Basler Cam (monochrome)
  • processing hardware

In general both lidarscanners output a cloud of points, where each point is given not only with standard x,y,z position attributes, but also with such as intensity information for each point. This value is a very good possibility for filtering and interpretation as values of important street environment facilities are equipped with a retroreflective surface, thus reflecting a higher amount of light back to the laserscanner than nature would usually allow in a common diffuse reflection. A heatmap-like colored pointcloud is used to visualize the intensity of returned points. The colder the colour, the higher the value of given point.

A rudimentary map is imported into the visualizer. This is directly taken from a section defined and exported from OpenStreetMaps: see ZalaZONE at OpenStreetMaps here.

Dynamic Platform Measurement

The following test is recorded at the dynamic platform as part of ZalaZONEs testground. For more information about the different sections see here.

The measurement at this section was setup as follows: Half way up the access stretch there is a RSU set-up, supposed for communication with the vehicle’s OBU, as well as there is a retroreflective section (1m) of lanemarker (provided by 3M) put out on the right side of the road, overlaying the usual lanemarkings (see figure below). Only the Velodyne VLP-16 is running in this test, therefore there isn’t such a high resolution given between laserscan layers.

Some of the recorded data:

  • gps positions of RSU and vehicle
  • pointcloud data
  • video data
  • communication RSU <–> OBU

Measurement starts at the far end of the access stretch to the dynamic platform passing the RSU and M3’s lanemarker strip halfway down the stretch and continuing on to the free space of the dynamic platform. Returning to the starting spot afterwards (see video below).

Goals are the evaluation of communication aspects (such as signal strength) between RSU & OBU and the investigation of pointcloud behaviour.

Fig. I: moment of approach

This snapshot shows the car at the moment of approach to the prepared lanemarker. The usual (standard) lanemarkings on the left and right of the lane are not retroreflective (colored red to orange, thus poor return value) in opposite to the prepared lanemarker: it’s value is very high and separates clearly from the ground around (indicated with green to blue color).

Fig. II: video and lidar visualization

This video shows the vehicle moving along the straight, passing the RSU and lanemarker onto the platform section. Important to mention here is the absence of lidar information of the street ahead and furthermore as soon as we are level with the platform section, there is no information (no points) to the right of the vehicle retrieved from the laserscanner. This is to be explained with the bad weather conditions on site. The wet surface of the street causes a total reflection of the light beams sent out.

Smartcity Measurement

This test is recorded at the Smart City Zone as part of ZalaZONEs testground. For more information about the different sections see here.

The hardware in use corresponds with the former setup, additionally the Ouster Lidar is in use as well.

Fig. III: top view of smart city ride

The RSU is set up on the bottom right, close to the starting point of the measurement, collected data corresponds to the data from the former measurement. Here again the pointcloud behaviour is targeted as well as the communication aspects.

The measurement procedure has the vehicle driving along the bottom of the map section, taking a right turn and doing a u-turn at the end of the street to take the way back. During this, a mixed driving profile with acceleration and deceleration at speeds ranging from 10-50 km/h is executed.

Fig. IV: smart city; view following

Street signs are well recognizable via intensity filtering (cold coloured points) of the pointcloud. The none-retroreflective (standard) lanemarkings are human-recognizable, but it’s hard to find a threshold as value differences compared to the street are not that significant. Still we retrieve more information from our surrounding environment as weather conditions are getting better and the street is not as wet as was with the former measurement.

An outgoing DENM is visualized as a pylon-texture during the ride around the section. In this case an aggressive deceleration leads to the output of this message. It is broadcasted to the surrounded vehicles.

Stay tuned for further information!

ROS Rviz – 360° LiDAR – Punktwolken Verdichtung

Im Rahmen des Forschungsprojektes „NIVES“ wird die Nutzung und Fusion verschiedener Sensoriken am Fahrzeug zur teils vollständigen Automatisierung von Fahrfunktionen untersucht. Dabei ist eine detaillierte Erfassung der Umgebung von besonderer Wichtigkeit. Mithilfe eines 360°-Laserscanners können viele Informationen der räumlichen Umgebung in das System eingespeist werden. Jedoch besitzt ein einzelner Scan (vgl. einzelnes Foto) nur eine vergleichsweise detailarme Abbildung der räumlichen Umgebung. Deshalb nutzen wir die Odometrie des Fahrzeugs, sowie GPS und GLONASS um eine Translation des Laserscanners im Raum festzustellen, die Punktwolke je Scan über die Zeit entsprechend zu transformieren und damit die Punktwolke zu verdichten.

Im nachfolgenden Video wurde die Punktwolke durch 200 einzelne Scans verdichtet.


Fahrdynamisches Praktikum Klettwitz

Vom 6. bis 7.07.2017 haben Studenten der HTW und der TU Dresden, aus den Fachbereichen der Fahrzeugtechnik und Fahrzeugmechatronik, am Fahrdyndamischen Praktikum auf dem DEKRA Testoval in Klettwitz teilgenommen.
An unserer Station wurden  Testfahrzeuge der FSD (VW Passat CC), IAV (VW Golf) und der HTW (BMW i3) mit Umfeldsensorik und Car2X Modulen ausgestattet. Im Video wird die Einscherer Erkennung des BMW i3 validiert. Alle Fahrzeuge sind mit Car2X Modulen ausgestattet, welche periodisch CAM Botschaften aussenden. Darin sind neben der aktuelle GPS Position, die Geschwindigkeit und Fahrzeugdimensionen  enthalten. Der i3 ist mit zwei Webcams (Fokus auf Frontscheibe und Kombiinstrument ) sowie einem 360° Velodyne LiDAR System ausgestattet. Die simultane Aufzeichnung aller Daten erfolgt über das Robot Operating System (ROS).  Im Nachhinein lassen sich die Daten abspielen und mit den ROS Werkzeugen RViz und MapViz visualisieren. Anhand dieser Messreihen können neue Algorithmen, z.B. zur Objekterkennung, entwickelt und getestet werden.

Mechlab @ Future Technologies

Das Labor für Kfz-Mechatronik der HTW Dresden nimmt an der Veranstaltung „Future Technologies / Science Match“  am 26.01.2017 teil. Insgesamt 100 Spitzen-Forscherinnen und Forscher aus den Technikwissenschaften stellen in je drei Minuten ihre neuesten Ergebnisse vor. Die drei Mechlab-Folien sind hier zu sehen:

Labor-Intro

Versuchsfahrzeug mit Umfeldsensorik

Studierende des Studiengangs Fahrzeugtechnik

Unser Dank gilt den beiden Studierenden Frau O. und Herrn Mario Herrera für die Unterstützung der Präsentation. Frau O. ist Studentin im 5. Semester Fahrzeugtechnik und freut sich schon auf die Veranstaltung Fahrzeug-Kommunikationssysteme bei Prof. Trautmann im kommenden Semester. Dort wird sie sich intensiv mit vernetzten und automatisierten Fahrzeugen auseinandersetzen (müssen…).

Herr Herrera ist Student im 7. Semester Fahrzeugtechnik und arbeitet bereits seit 2 Jahren im Mechlab-Team. Seine derzeitige Aufgabe ist die Ausstattung eines Renault-Twizy mit zusätzlicher Bremsaktorik zur Realisierung autonomer Fahrfunktionen wie Valet-Parking und Platooning.

Lichtschranken Messanlage mit CAN Anschluss in Betrieb genommen

Leuze RK 96M/P-1440-21

Lichtschranken Messanlage in Betrieb genommen. Erste Testmessung im Technikum der HTW Dresden. Als Versuchsfahrzeug wurde ein Elektroroller genutzt. Die visualisierte Ausgabe der CAN Signale erfolgte im Program CANoe.

Lichtschranken Messanlage mit 12 Lichtschranken der Firma Leuze . Die Lichtschranken sind vom Typ RK 96M/P-1440-21.

Leuze RK 96M/P-1440-21
Lichtschranke Leuze

In der Messbox befindet sich eine elektrische Schaltung zur Auswertung der Signale. Mit dem Mikrocontroller AT90CAN werden die Signale digitalisiert und auf den CAN Bus ausgegeben.

Messbox für Lichtschranken


Technische Details:

Die Anlage ist frei konfigurierbar von einer Lichtschranke bis zu max. 14 Lichtschranken. Die Abstände zwischen den Lichtschranken kann ebenfalls frei gewählt werden. Die Lichtschranken werden über zwei Kabel mit der Messbox verbunden. Ein zwei adriges Kabel für die Spannungsversorgung. Ein Ethernetkabel für die Signalübertragung.  Die Spannungsversorgung von 24 Volt für die Lichtschranken stellt ebenfalls die Messbox zu Verfügung.


Team-Mechlab betreut Versuch beim Gesamtfahrzeugpraktikum

Das Team des Labors für Kfz-Mechatronik hat am Gesamtfahrzeugpraktikum „Lausitzring“ der TU Dresden vom 02.07-03.07.2015 teilgenommen und den Versuchstand „Fahrzeugakustik und Umfeldsensorik“ betreut. Die folgenden Versuche wurden an der Station durchgeführt:

  • Messung der Geräuschemissionen nach DIN ISO 362-1 von verschiedenen Fahrzeugen
  • Objekterkennung mittels Laserscanner
  • Car2x-Kommunikation

Das Praktikum fand in diesem Jahr erstmals auch für Fahrzeugtechnik-Studenten der HTW Dresden statt. Insgesamt mehr als 160 Studenten beider Einrichtungen konnten an den 7 Versuchsständen aktuelle Entwicklungen der Fahrzeugtechnik selbst erproben und somit einen praxisnahen Einblick in das Berufsbild gewinnen.

Versuchsaufbau zur Geräuschmessung und zur Umfeldsensorik

Auswertung der Messdaten

Abschlussfoto aller Teilnehmer