Im Rahmen der Diplomarbeit von Lu Jiang (TU Dresden, Professur für Informationstechnik für Verkehrssysteme) wurde ein Algorithmus zur Realisierung von Platooning umgesetzt.
Im Fokus stand dabei die Anwendung einer modellprädiktiven Regelung. Vor dem Test auf dem Prüffeld erfolgte der Entwurf des Regelkreises simulativ. Im Anschluss wurden die Regelkreisparameter für den automatisierten BMW Tech i3 auf dem Prüffeld erprobt und angepasst. Für die Ansteuerung der Längs- und Querführung wurde der modellprädiktiven Regelung eine PID Regelung nachgelagert. Das Führungsfahrzeug, der BMW i3 der TU Dresden und das automatisierte Folgefahrzeug sind mit einem WLANp-Funkmodul ausgerüstet. Das Funkmodul im Führungsfahrzeug erhält die aktuelle Position über eine Real-Time Kinematic GNSS Einheit und übermittelt die aktuelle Position und die Beschleunigung an das Folgefahrzeug. Das Folgefahrzeug hält bei aktiviertem Platooning in Abhängigkeit der Geschwindigkeit den Abstand.
Im Training konnte das Szenario bis zu 4 m/s stabil durchgeführt werden. Das nachfolgende Video repräsentiert den aktuellen Stand der Umsetzung.
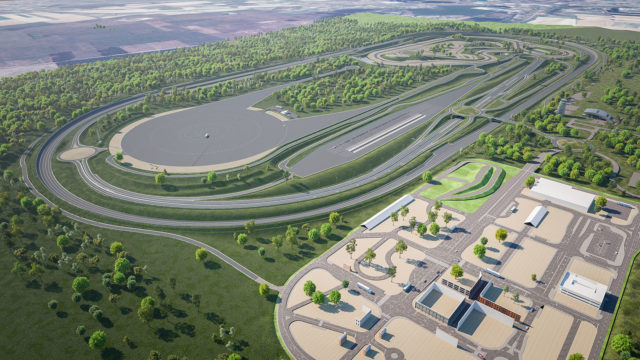
We visited ZalaZONE late November this year. It is located in Zalaegerszeg, Hungary, one hour east of the Austrian-Hungarian border. With about 260 ha of space the ZalaZONE test ground provides test oppertunities and facilities for the testing of a wide range of future mobility concepts. Though a lot of the test ground is still „work-in-progess“, within our cooperation with ZalaZONE we were granted access to establish some test sequences on the completed testsections.
Following measurements were recorded on November 28th with mostly poor weather conditions (cloudy, occasional light to heavy rain). The measurements took place in different designated areas of the testground. The following interpretation discusses general effects, problems and characteristics of the lidar pointcloud(s) and partly introduces and discusses the testfield area in use.
The hardware being used consits mainly of some of the following parts:
In general both lidarscanners output a cloud of points, where each point is given not only with standard x,y,z position attributes, but also with such as intensity information for each point. This value is a very good possibility for filtering and interpretation as values of important street environment facilities are equipped with a retroreflective surface, thus reflecting a higher amount of light back to the laserscanner than nature would usually allow in a common diffuse reflection. A heatmap-like colored pointcloud is used to visualize the intensity of returned points. The colder the colour, the higher the value of given point.
A rudimentary map is imported into the visualizer. This is directly taken from a section defined and exported from OpenStreetMaps: see ZalaZONE at OpenStreetMaps here.
Dynamic Platform Measurement
The following test is recorded at the dynamic platform as part of ZalaZONEs testground. For more information about the different sections see here.
The measurement at this section was setup as follows: Half way up the access stretch there is a RSU set-up, supposed for communication with the vehicle’s OBU, as well as there is a retroreflective section (1m) of lanemarker (provided by 3M) put out on the right side of the road, overlaying the usual lanemarkings (see figure below). Only the Velodyne VLP-16 is running in this test, therefore there isn’t such a high resolution given between laserscan layers.
Some of the recorded data:
gps positions of RSU and vehicle
pointcloud data
video data
communication RSU <–> OBU
Measurement starts at the far end of the access stretch to the dynamic platform passing the RSU and M3’s lanemarker strip halfway down the stretch and continuing on to the free space of the dynamic platform. Returning to the starting spot afterwards (see video below).
Goals are the evaluation of communication aspects (such as signal strength) between RSU & OBU and the investigation of pointcloud behaviour.
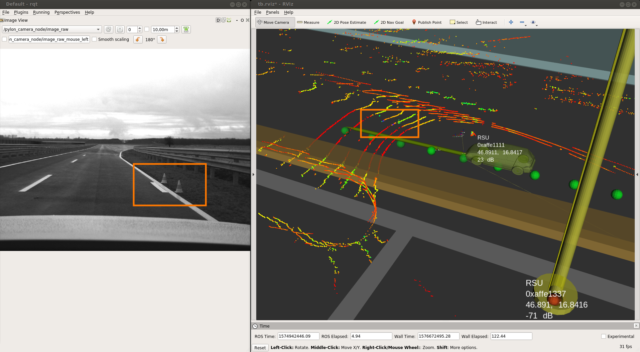
Fig. I: moment of approach
This snapshot shows the car at the moment of approach to the prepared lanemarker. The usual (standard) lanemarkings on the left and right of the lane are not retroreflective (colored red to orange, thus poor return value) in opposite to the prepared lanemarker: it’s value is very high and separates clearly from the ground around (indicated with green to blue color).
Fig. II: video and lidar visualization
This video shows the vehicle moving along the straight, passing the RSU and lanemarker onto the platform section. Important to mention here is the absence of lidar information of the street ahead and furthermore as soon as we are level with the platform section, there is no information (no points) to the right of the vehicle retrieved from the laserscanner. This is to be explained with the bad weather conditions on site. The wet surface of the street causes a total reflection of the light beams sent out.
Smartcity Measurement
This test is recorded at the Smart City Zone as part of ZalaZONEs testground. For more information about the different sections see here.
The hardware in use corresponds with the former setup, additionally the Ouster Lidar is in use as well.
Fig. III: top view of smart city ride
The RSU is set up on the bottom right, close to the starting point of the measurement, collected data corresponds to the data from the former measurement. Here again the pointcloud behaviour is targeted as well as the communication aspects.
The measurement procedure has the vehicle driving along the bottom of the map section, taking a right turn and doing a u-turn at the end of the street to take the way back. During this, a mixed driving profile with acceleration and deceleration at speeds ranging from 10-50 km/h is executed.
Fig. IV: smart city; view following
Street signs are well recognizable via intensity filtering (cold coloured points) of the pointcloud. The none-retroreflective (standard) lanemarkings are human-recognizable, but it’s hard to find a threshold as value differences compared to the street are not that significant. Still we retrieve more information from our surrounding environment as weather conditions are getting better and the street is not as wet as was with the former measurement.
An outgoing DENM is visualized as a pylon-texture during the ride around the section. In this case an aggressive deceleration leads to the output of this message. It is broadcasted to the surrounded vehicles.
Stay tuned for further information!
Cookie-Zustimmung verwalten
Um dir ein optimales Erlebnis zu bieten, verwenden wir Technologien wie Cookies, um Geräteinformationen zu speichern und/oder darauf zuzugreifen. Wenn du diesen Technologien zustimmst, können wir Daten wie das Surfverhalten oder eindeutige IDs auf dieser Website verarbeiten. Wenn du deine Zustimmung nicht erteilst oder zurückziehst, können bestimmte Merkmale und Funktionen beeinträchtigt werden.
Funktional
Immer aktiv
Die technische Speicherung oder der Zugang ist unbedingt erforderlich für den rechtmäßigen Zweck, die Nutzung eines bestimmten Dienstes zu ermöglichen, der vom Teilnehmer oder Nutzer ausdrücklich gewünscht wird, oder für den alleinigen Zweck, die Übertragung einer Nachricht über ein elektronisches Kommunikationsnetz durchzuführen.
Vorlieben
Die technische Speicherung oder der Zugriff ist für den rechtmäßigen Zweck der Speicherung von Präferenzen erforderlich, die nicht vom Abonnenten oder Benutzer angefordert wurden.
Statistiken
Die technische Speicherung oder der Zugriff, der ausschließlich zu statistischen Zwecken erfolgt.Die technische Speicherung oder der Zugriff, der ausschließlich zu anonymen statistischen Zwecken verwendet wird. Ohne eine Vorladung, die freiwillige Zustimmung deines Internetdienstanbieters oder zusätzliche Aufzeichnungen von Dritten können die zu diesem Zweck gespeicherten oder abgerufenen Informationen allein in der Regel nicht dazu verwendet werden, dich zu identifizieren.
Marketing
Die technische Speicherung oder der Zugriff ist erforderlich, um Nutzerprofile zu erstellen, um Werbung zu versenden oder um den Nutzer auf einer Website oder über mehrere Websites hinweg zu ähnlichen Marketingzwecken zu verfolgen.